Last Modified: October 17th, 2023
6 min read

Dashboards and Key Performance Indicators (KPIs) are one of the most essential elements of the NetSuite user experience, providing users with a real-time view of their business. By creating high-quality dashboards that prioritize important job tasks for each role within an organization, businesses can ensure that employees are able to quickly access the data that they need to make informed decisions.
1. Personalize Dashboards for Users and Roles

Dashboards can be personalized for users and roles in many ways. Using portlets, which are collections of real-time data, you can customize your dashboards to show the specific information that is relevant to you. On both your home dashboard and most Center dashboards, you can click “Personalize” to open a list of portlets you can add to your dashboards. Drag and drop these portlets into position, and then hover over each one to see how many of that type of portlet are remaining. Some examples of the types of portlets you can add include report snapshots and trend graphs. Additionally, the “Show Portlet Hint” function is enabled by default, which will highlight a portlet on the dashboard when you hover over its title. This feature is especially helpful if you change the name of a portlet title. Overall, personalizing your dashboards with portlets allows you to access only the data that is relevant to you and your role quickly and easily.
2. Setting Up KPI Portlets and KPI Meters
Key performance indicators (KPIs) are essential metrics used to measure and highlight changes in business drivers as they occur. To make tracking KPIs easy, NetSuite offers more than 75 pre-packaged KPIs based on standard reports, all of which can be found in the NetSuite Help documentation. These KPIs are tailored to each user’s role, so you will only see KPIs based on reports that are relevant to your specific job.
KPI portlets
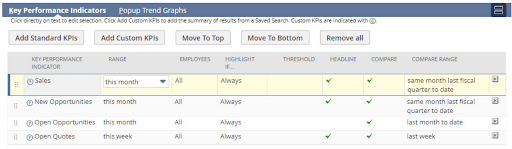
Adding the KPI portlet to the top of the widest column of your home dashboard provides an optimal amount of space to view your data. Alternatively, you can add KPIs to any other column. To do this, click ‘Setup’ on the KPI portlet. NetSuite will already present some recommendations regarding KPIs for your role. To add or remove these KPIs, click ‘Add Standard KPIs.’ You can also customize the order of the displayed KPIs by moving them around. For comparison purposes, you can set a data range as well as a comparison range. Ensure that both date ranges complement each other such as month-to-month or year-over-year.
Custom KPIs
NetSuite’s Saved Search feature enables users to construct custom KPIs and metrics to keep tabs on specific trends relevant to the business. For instance, if an organization wants to compare average expenses across diverse locations, it wouldn’t be possible with the standard Expenses KPI, which only provides a total sum of all expenses. A Saved Search allows users to compare numerous dimensions when creating their comparisons.
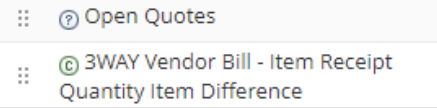
The KPI list also features icons that indicate the type of KPIs being used—a ? indicates a standard KPI while a C stands for custom. If an organization wants to get a visual display showing the performance of multiple KPIs at once, they can use headlines to achieve this outcome—however, it is advisable not to overload the headlines as it could diminish the impact of the underlying KPI data.
KPI meters
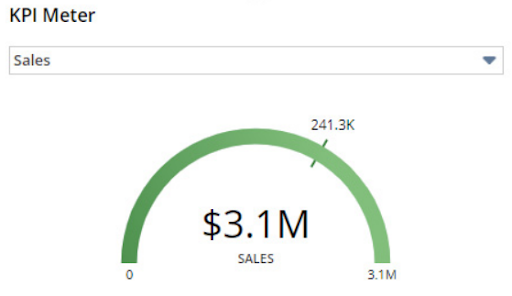
KPI meters are an effective way to track and monitor key performance indicators (KPIs) for your business. With KPI meters, you can create graphical representations of your KPIs that are simple and easy to understand. You can display up to three KPI meters on each dashboard, allowing you to quickly get a snapshot of important metrics.
KPI meters also make it easy to adjust the data window on your KPIs and reports. Simply use the Portal Date Selector next to Personalize on the dashboard to modify the period of time for which your data is displayed. This helps keep you up-to-date with critical information, allowing you to make informed decisions quickly and efficiently.
3. Customizing KPI Scorecards
KPI scorecards provide a powerful tool for businesses to analyze their performance, offering more depth and detail than standard KPI portlets. With the ability to create custom date ranges and compare data between different divisions, KPI scorecards are an invaluable asset for tracking progress over time.
One of the primary advantages of KPI scorecards is that they allow you to track changes and trends. You can set up different scorecards for specific departments or teams, allowing you to measure their performance over time. This makes it easy to identify areas of improvement and potential targets for development.
KPI scorecards also enable businesses to make meaningful comparisons between different divisions or departments. By setting up multiple KPI scorecards with different KPIs, you can compare the performance of each division side-by-side or even over specific periods. This allows for more detailed analysis and accuracy when forecasting future trends in business performance.
KPI scorecard setup
The KPI scorecard is an essential component of any analytics system, and must be enabled by the administrator to gain access to the full range of insights. To enable the KPI scorecard, simply navigate to the ‘Enable Features’ menu within the Analytics tab. Once there, check off the box next to KPI Scorecards box.
Creating a new scorecard
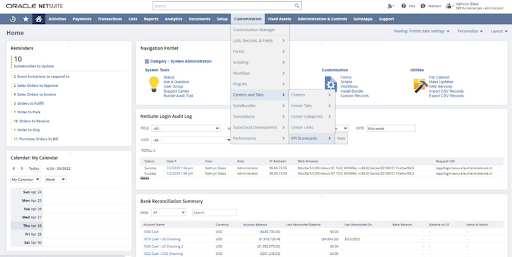
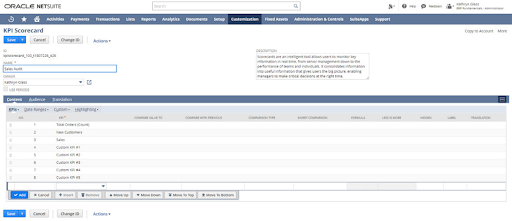
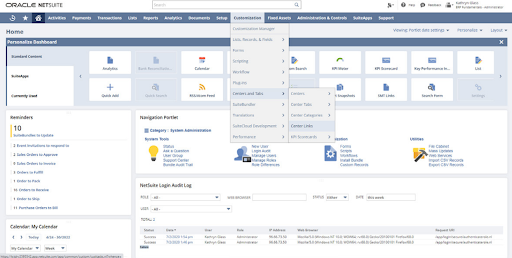
Creating a new scorecard is easy and straightforward. To begin, you can either search for Page: New KPI Scorecard or navigate to Customization > Centers and Tabs > KPI Scorecard. When you arrive at the desired page, give your new scorecard a name that will be visible on your dashboard in order to improve organization.
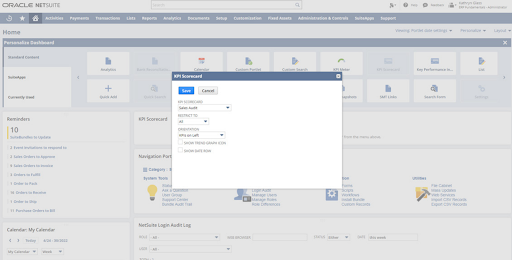
Once you have named your scorecard, determine whether you want to use Date Ranges or enable Use Periods to build the scorecard. You can then decide if you would like to use standard KPIs or create custom KPIs for your scorecard. If creating custom KPIs, click the “Custom” tab and choose the KPIs you want to use. You will also need to select values and comparison types for each KPI, as well as add formulas to display the information in a meaningful way on your scorecard.
Add customized scorecards to your dashboard
If you are looking to add a personalized touch to your dashboard, the KPI Scorecard Portlet is the perfect solution! This feature allows you to customize and create your own scorecards, enabling you to track important metrics related to your business on a single page. To get started, simply navigate to the Personalize tab and add the KPI Scorecard Portlet to your home dashboard. Then, click “Setup” to select the customized scorecard you created.
4. Creating Custom Centers
NetSuite offers administrators the ability to customize role-specific centers and tabs in order to create a more tailored navigation experience for their users. This is done by creating custom records and then adding them to the relevant roles, allowing companies to create a personalized user experience that best meets their business needs.
Not only does this allow for a more tailored user experience, but it also helps to minimize support time for users as they are able to navigate the system more easily. Additionally, this feature can be used to drive key business processes by prompting users with a specific set of tasks or functions when they log in. By creating custom centers and tabs in NetSuite, administrators are able to easily customize the user experience. This feature can help businesses optimize their system navigation and drive key business processes for their users with greater efficiency.
Creating custom centers in your business dashboard can be a great way to quickly link to various URLs and display the most important content to you and your team. To ensure your custom centers are organized and effective, it’s best practice to start from the bottom up. Start by adding links, such as reports, which will then allow you to add categories, tabs and finally centers. It’s important to also provide a unique name for your custom center so that you don’t duplicate an existing one.
Finally, adding portlets to a custom tab can help you personalize your business dashboard with content not typically available on the prebuilt dashboards. With these tips, you can ensure your custom centers are organized and effective.
For an even more detailed explanation of the above topics, download this fresh ebook on: